
Election spending in the Philippines, 2001-2024 – BusinessWorld Online
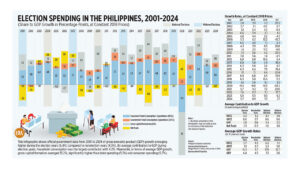
This infographic shows official government data from 2001 to 2024 of gross domestic product (GDP) growth averaging higher during the election years (6.4%) compared to nonelection years (4.3%). By average contribution to GDP during election years, household consumption was the largest contributor with 4.2%. Meanwhile, in terms of average GDP growth, gross capital formation averaged 15.2%, significantly higher than state spending (5.1%) and consumer spending (5.7%).
MORE STORIES